Are you a Master student in Computer Science, Physics, or a related field and do you have an interest in applying state-of-the-art machine learning methods to solving real-life challenges in science? Are you willing to go further than your comfort zone and learn about molecular absorption spectroscopy and its applications for trace gas detection? We may have just the project for you! Bear with us and read what it is all about:
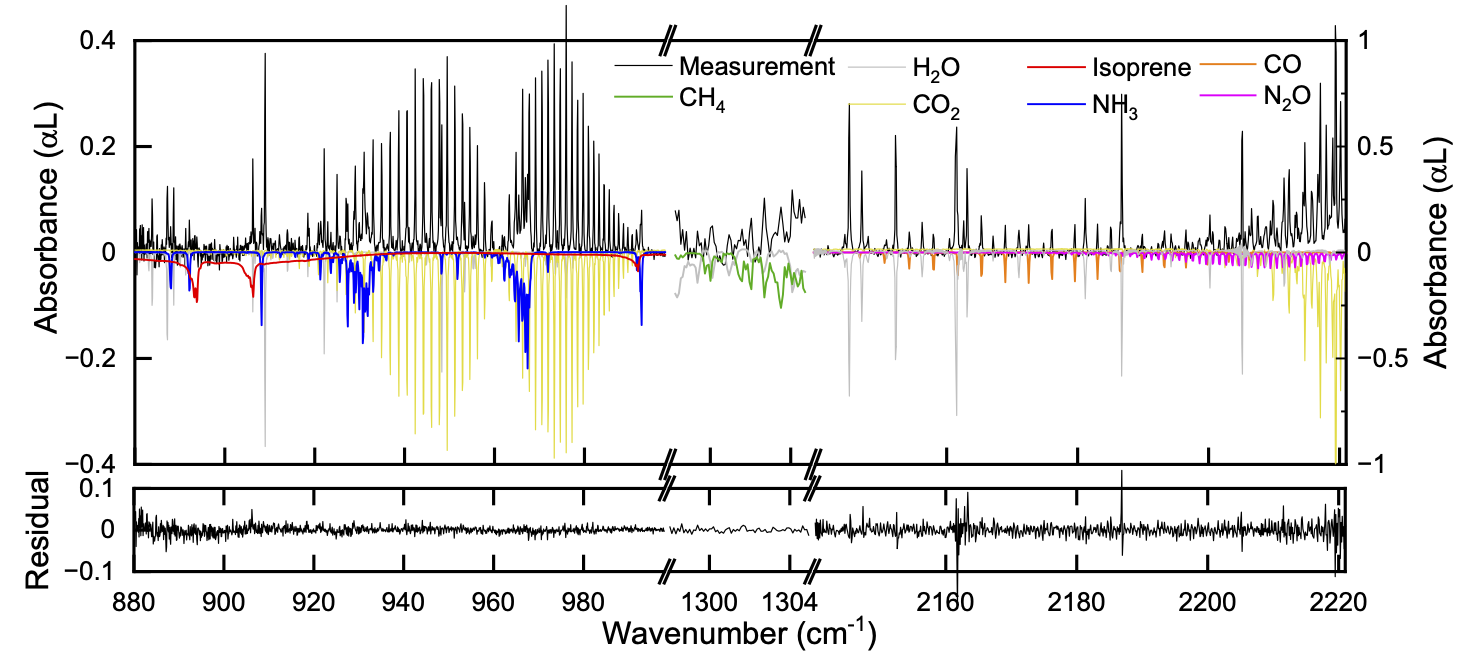
The sensitive detection of trace gases is of vital importance for environmental monitoring and can have many interesting applications in for instance medical diagnostics and plasma-based fuel synthesis. Due to the characteristic optical absorption features of gas and plasma species, laser absorption spectroscopy has proven a particularly powerful technique to perform highly selective and sensitive quantitative measurements.
In most applications, it is preferable to obtain simultaneous measurements of multiple compounds. However, as most types of lasers only emit in a very narrow wavelength range, the simultaneous measurement of multiple compounds typically requires the use of multiple lasers. Recently, however, there have been extensive developments in the field of ultrabroadband (supercontinuum) laser sources. This opens up the possibility to perform quantitative measurements of many compounds at the same time with just one laser source.
One of the main challenges in the application of supercontinuum laser sources for trace gas sensing is the separation of the absorption features of the compounds of interest from the baseline signal. Traditionally, simple mathematical models are fitted to the signal to spectra to model the baseline and extract the relevant features. However, this approach suffers from some difficulties and disadvantages—in particular in the case of broader absorption features, or the presence of very strong absorption features of interfering compounds.
For that reason, we aim to apply more advanced machine learning techniques—including deep learning—that can learn complex, non-linear patterns in the data. To support the requirements of advanced machine learning models to be trained on large datasets, we have developed a method to create hybrid data, consisting of real baselines with modelled absorption features. Although our initial findings are showing great promise, there is still a lot of room for improvement.
Specifically, we aim to explore the following topics:

Your research will be conducted in the Trace Detection Laboratory (TDLab), part of the Institute for Molecules and Materials (IMM) of the Faculty of Science at Radboud University, in close collaboration with the Data Science (DaS) group, at the Institute for Computing and Information Sciences (iCIS). We have a vibrant and enthusiastic group of young researchers working at the crossroads of physics, chemistry, and biology. We will help you get a basic understanding of molecular absorption spectroscopy to understand the relevant physics and become familiar with the available molecular absorption databases. You will work closely with one of the postdocs in our group and receive full support from other members of TDLab. The final goal is to develop a streamlined computational tool that can process a wide range of broadband gas absorption spectra to predict baselines, extract absorption features, and predict gas concentrations.
Interested? Need more information? Please contact Simona Cristescu of the Trace Detection Laboratory (TDLab) and/or Tom Claassen of Data Science. We will be happy to talk to you!
[1] Huang C., et al “Deep-learning-enabled high-fidelity absorbance spectra from distorted dual-comb absorption spectroscopy for gas quantification analysis,” Applied Spectroscopy 78(3), 310-320, (2024) doi:10.1177/00037028231226341